What is a Good Retention Rate for a Private SaaS Company in 2023?
August 11, 2023
As we have noted for many years, revenue retention is one of the most important metrics for ensuring medium- to long-term business health due to its compounding effect on growth. The relationship of new sale bookings to revenue retention is the SaaS version of “offense wins games, defense wins championships.”
Measuring key metrics over time offers insight into how a company is evolving. It’s also essential to benchmark metrics against peers to understand what’s “normal” and gauge the potential impact of the macro environment. And for private SaaS companies, benchmarking retention against public SaaS companies is of limited usefulness. The sheer scale of public companies makes for an apples-to-oranges comparison to smaller, private companies that may prove misleading or distracting. To solve for this information gap, we started conducting our annual survey more than a decade ago to help scale-up-sized, private companies better understand how their performance compares to that of their peers.1
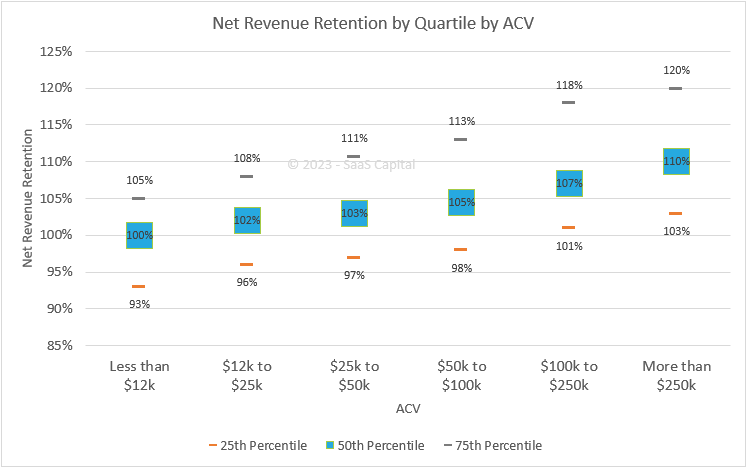
For example, if a company with an Average Annual Contract Value (ACV) of $30,000 “only” increased Net Revenue Retention (NRR) from 111% to 112%, there might be concerns that more needed to be done. However, as the data below shows, the median NRR for companies with ACVs of $25,000 to $50,000 is 103%. So, while the absolute change in NRR was small, the company is in the 75th percentile of its peers so it’s already well-optimized.
Before we get into the current SaaS retention benchmarks, it is important to understand the metrics and how they are calculated.
Retention Definitions – Retention or Churn?
Retention is, of course, the glass-half-full cousin of “churn,” the enemy of all SaaS businesses. In the numbers that follow, churn is usually best described as (1 – “gross retention”), meaning, if you have 95% gross retention, that equals 5% churn. Net retention, in turn, adds to gross retention the positive effect of upsells, so net retention is always higher than gross retention. And, the means of calculation should follow a cohort over time for consistency.
Net Revenue Retention Formula
In our survey, we asked companies to report their net and gross annual revenue retention data. Customer account retention may be a useful metric for you to track, but our focus in the survey, and generally the retention metric we think is the most important, is based on dollars of revenue. We define net retention as:
(Monthly Recurring Revenue in December of 2022 only from customers who were customers in December 2021)
÷
(Total MRR in December 2021)
NRR can be anything from 0% to well above 100%, as it includes upsells, new product cross-sells, and price increases.
Gross Revenue Retention Formula
GRR is the same formula, excluding the upsells, cross-sells, and price increases. (For easy calculation, set each customer’s 2021 MRR to be less than or equal to their 2021 MRR.) For this reason, gross retention cannot exceed 100%.
2023 Private B2B SaaS Retention Benchmarks
For retention, benchmarking by ACV is the best starting point. More than by company age, revenue level, or industry, companies that share a similar selling price have the most in common. They will be organized similarly, go to market similarly, and support customers similarly. The opposite is true of two companies selling a $19.99/month product versus a $250,000/year product. The chart below shows that higher net retention correlates with higher ACVs. The chart below shows median NRR and median GRR across a range of annual contract values (ACVs).
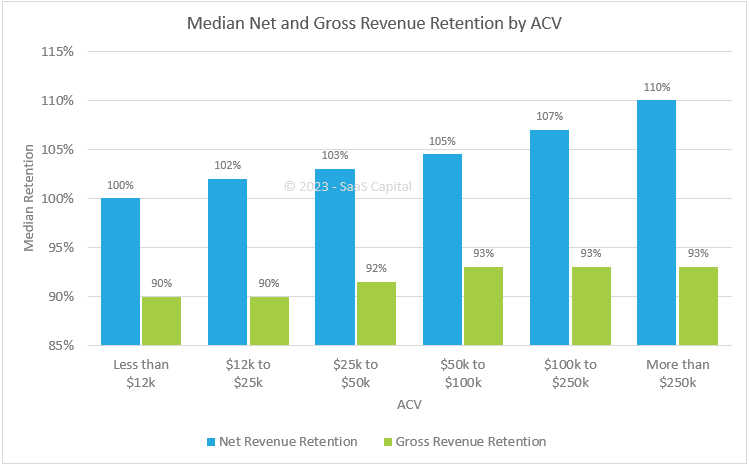
The key takeaway is that higher net retention correlates with higher ACVs. The relationship between ACV and GRR is more subtle but still there. Companies with the very highest ACVs have the highest gross retention. Companies with ACVs above $25,000 show median gross revenue retention of ~93%, while companies below $25,000 show 90% median gross revenue retention. This relationship makes intuitive sense. Higher-priced solutions often involve a longer sales cycle, in-depth scoping and implementation, and dedicated support and account management, all of which yield a stickier product.
Net Revenue Retention Quartiles
Digging deeper into the net revenue benchmarks, the chart below shows NRR broken into quartiles for the same ACV categories. Companies with ACVs above $25,000 show median net revenue retention of at least 103%. However, as the chart shows, even the 25th percentile for these companies report NRR of 97% to 103%. Top-quartile companies with ACVs north of $100,000 report NRR of 118% to 120%.
The Impact of Net Revenue on Growth Rates
Generally speaking, higher growth is associated with higher retention and vice versa. This is the “leaky bucket” metaphor. The higher your retention, the easier it is to grow that much faster because you don’t have to first refill the bucket before adding to it. The impact of retention is also cumulative as it repeats and expands on itself year after year. The opposite is also true.
The chart below shows there is a strong and exponential correlation between net revenue retention and growth. The correlation between growth and NRR is intuitive, as net retention includes what are essentially new “sales” in the form of price increases, upgrades, upsells, and cross-sells, all of which help grow revenue year-over-year. The cumulative compounding nature of NRR is clearly evident.
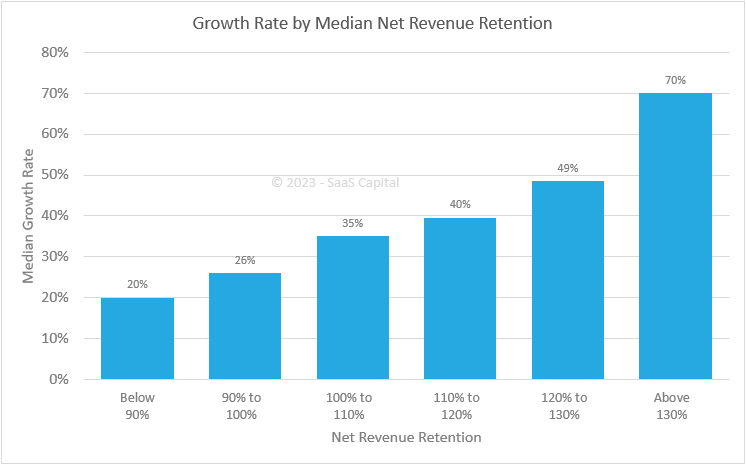
Across the entire survey sample of companies with more than $1 million in Annual Recurring Revenue (ARR), the median growth rate was 34%. The growth rates for groups of companies with NRR of at least 110% were higher than the population median, and the growth rate for companies with NRR below 100% was lower than the population median.
Increasing NRR from the 90% to 100% range to the 100% to 110% range improves growth rate by 9 percentage points. Companies with the highest NRR report median growth that is double the population median. This is a rare example of increasing returns from investment in upsells and cross-sells.
Additional Retention Data and Resources
We explore the data above more robustly in our Research Brief 2023 SaaS Retention Benchmarks for Private B2B Companies. Takeaways from that analysis include:
- Across all SaaS companies, the 2023 median net retention is 102%, which is unchanged from 2022. Median gross retention is 91%, also unchanged from the previous year’s survey.
- Gross retention during the first 5 years of a company’s life may be artificially elevated until customers have had enough time to churn. GRR by ARR corroborates this point, and, while the changes are slight, GRR declines as companies reach $3 million of ARR, then stabilizes.
- Equity-backed companies report slightly higher net revenue retention than bootstrapped companies while there was no reported difference in gross retention. Historically, VC-backed companies have had higher retention across both metrics and the erosion of that relationship suggests that best practices in customer success are now fully disseminated.
- Contracting length shows a potentially developing relationship where multi-year contracts show higher median net revenue retention and median gross revenue retention.
You can download the full breakdown here.
Our Approach
Who Is SaaS Capital?
SaaS Capital® is the leading provider of long-term Credit Facilities to SaaS companies.
Read MoreSubscribe