Exploring the Cost of Capital for SaaS Companies – Part II: Closing the Public-Private Gap
November 17, 2023
This is the second in a series on “Exploring the Cost of Capital for SaaS Companies.” If you’re not already familiar with the challenges of estimating the cost of equity, it might be helpful to start by reading the introduction and Part I.
In Part I, we estimated the cost of equity for public SaaS companies at 14.9% as a long-term average. However, you can’t just use numbers from public companies and apply them, unadjusted, to private companies. Private companies tend to have lower valuations than their public counterparts due to less liquid markets for their shares.
Furthermore, size matters – larger SaaS companies are more likely to be profitable due to economies of scale. They’re also more likely to be public: in the USA, private companies have to have a threshold size – around $100 million ARR – in order to be considered candidates for a successful IPO. For example, the LTSCI components had a median ARR of $145 million when we began tracking them (LTSCI are the long-term components of the SCI that went public before 2013; see Part I).
Since liquidity and size both carry premiums, we expect a substantial difference in valuations between smaller, private SaaS companies ($1-100 million in ARR) and the larger public comparables. How do we quantify this, though?
Private Model Predictions vs. Public Observed Valuations
Another way to approach the question is, “if this large public company (with a known valuation multiple) were instead small and private, how much lower would its valuation multiple be?” The answer would therefore tell us what proportion of the valuation is solely attributable to public liquidity and large size – the “premiums” in question.
We decided to “eat our own dog food.” For each company in the LTSCI, we compared the predicted valuation multiples from our “What’s my SaaS company worth?” valuation white paper, against the observed values of the LTSCI components over time. Because our valuation model is trained on small, private SaaS companies, its predictions of value will tend to be lower than the public comps – and the difference should reveal the premiums.
Discount from observed public multiple to private-trained model prediction, average:
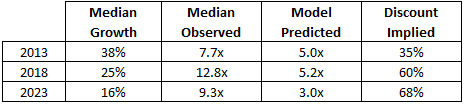
The model consistently predicted a multiple that was usually under half of the observed public multiple. This might be surprising, but we explain below why it could make a lot of sense. It’s our proposal to use up to 66% (or ⅔) as a discount to public comparable multiples when working with private SaaS companies.
Pure Public-Private Discount: 1/3
We propose that merely by being private instead of public, a SaaS business might be estimated to have a 33% non-public (including “lack of marketability”) valuation discount.
Keep in mind that the LTSCI companies in 2013 were relatively fast-growing, but slowed their growth rate as they grew. In 2013, they were all newly public – just past the cusp of the public-private gap – and so approximately all of the 35% modeled “discount” was simply by virtue of being public.
Even though this approach may seem simplistic, there’s support beyond just our own estimate to think it has merit. For example, the widely cited Kooli study of private acquisitions found a 34% private-company discount
Others have proposed data-driven estimates between 18% and 40%, with most estimates between 25-35%.
Size Discount: 1/3
We propose another 33% discount should apply to the smallest of SaaS businesses, with the discount decreasing as a company increases in size to $100 million ARR (the IPO threshold). Smaller companies are more volatile and less financially secure, with less access to capital, worse economies of scale, and less market power, all else equal. (What they offer, of course, is a potentially spectacular growth rate and lots of “headroom” to grow.)
We think these comparisons make our split rule-of-thumb reasonable: ⅓ off for the public-private gap per se, and up to another ⅓ off for companies much smaller than the $100 million IPO threshold.
Sanity-Checking the Rule of Thumb
Today, the median multiple of the LTSCI is 9.3x, and the median growth rate is 16% – fine for a mature company, but frankly lackluster for a small private SaaS business. But what if instead of being valued as large, publicly traded companies, their multiples were like those of tiny private SaaS companies with similar growth? The median output of our valuation model when run on the companies’ growth metrics produces 3.0x – just about ⅓ of the observed public multiple, implying the maximum discount of 66% (33% for private, 33% for size).
A 3.0x multiple is low but reasonable today for a tiny SaaS company growing 16%. Likewise, if we reversed that reasoning and asked what a $100 million SaaS company growing at 16% might expect today, a 6.0x would not be unreasonable. That tends to validate the 33% private-only discount.
This rule of thumb isn’t perfect – such rules never are – but we think there’s some merit here.
Quantifying a Private Company’s Cost of Equity Range
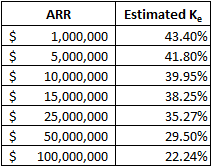
Given the 14.9% observed 5-year return on equity for large, (very) mature public SaaS companies in the LTSCI, and given a range of public-private discounts from 33-66%, our reasoning above points to a cost of equity range from 43% (for the smallest SaaS companies) to 22% (for SaaS companies around $100 million in ARR).
For those who want a formula for this method of estimation:
Ke(private) ~ 14.9% / (1 – (66% – (33% * (ARR[min 1 million, max 100 million]/100 million) )
Private SaaS Ke estimated only based on size and private company discounts:
With this formula, we have a bit more guidance – but we’re still not taking a company’s growth rate into account. That feels strange, given that valuation is so closely tied to growth. This is something we’ll explore Part III.
Our Approach
Who Is SaaS Capital?
SaaS Capital® is the leading provider of long-term Credit Facilities to SaaS companies.
Read MoreSubscribe