SaaS Benchmarks from Our 2018 Survey
May 2, 2019
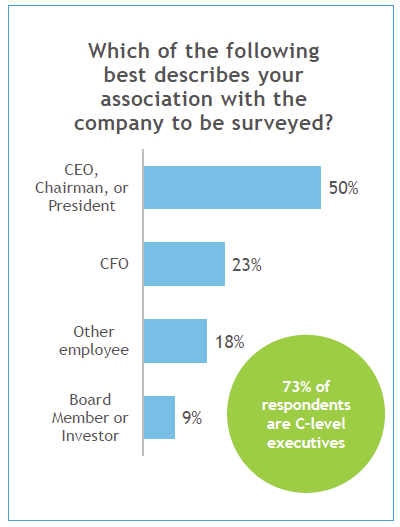
Each year SaaS Capital conducts the largest survey of its kind to gauge the overall performance of private B2B SaaS companies. Below are some of the results from the survey we conducted in 2018 which covered the 2017 financial performance of more than 900 SaaS companies from across the globe. (Results from the 2019 survey are currently only available to survey participants.)
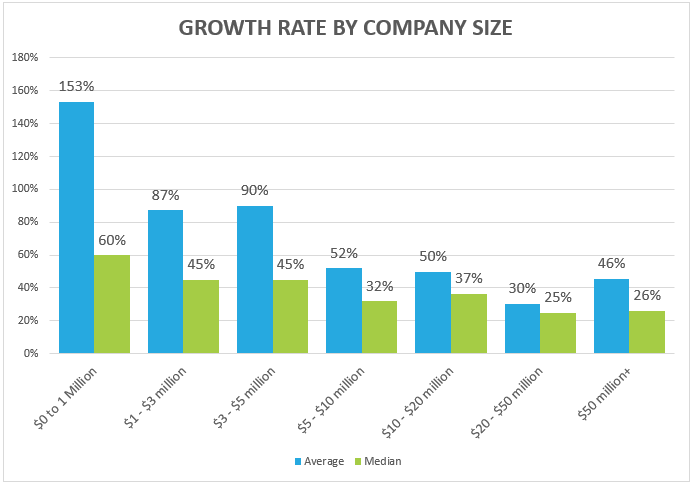
SaaS Growth Rates
If you have been studying SaaS metrics for very long, you know that growth rates differ significantly based on company size. Many SaaS companies with less than a million in revenue double in size each year, while it’s rare (and much more difficult) for a $20 million SaaS company to do the same. For a deeper dive here, download Benchmarking Private SaaS Company Growth Rates.
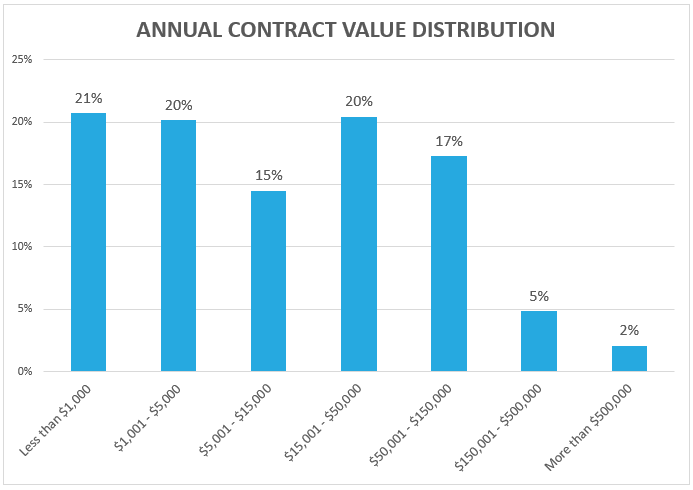
Annual Contract Value
Selling a lightweight SaaS product online is much different than selling a $100,000 per year subscription to a large enterprise. Here is how the SaaS market breaks down based on Annual Contract Value (ACV).
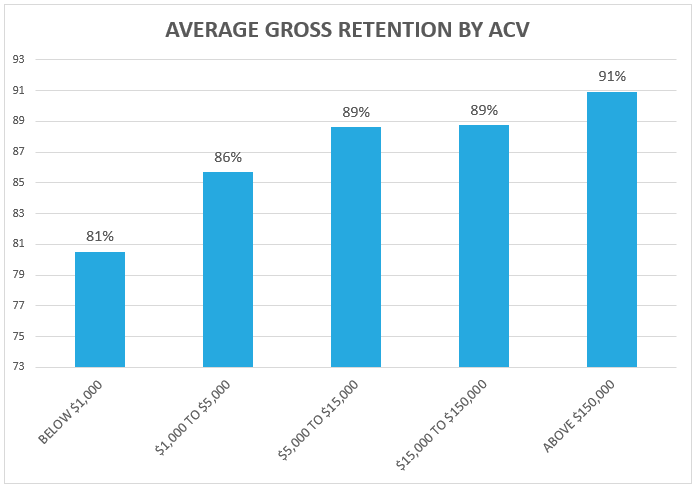
Retention
Revenue retention is the most important of all SaaS metrics but benchmarking your business on this metric can be tricky. The key variable to control for is ACV. More expensive SaaS products require a larger financial and time investment on the part of the buyer and are naturally more “sticky.” Larger ACV products are also bought by larger and more stable customers who do not go out of business frequently.
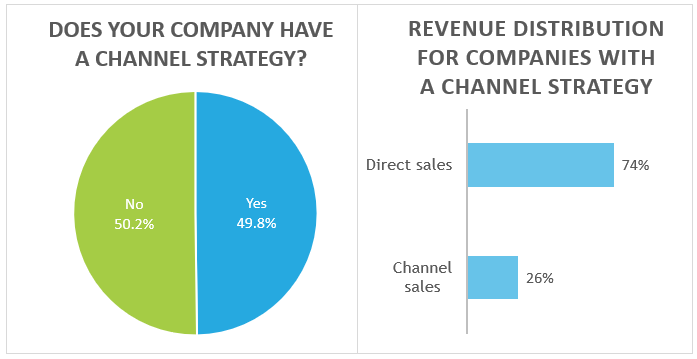
Channel Sales
Another important and emerging topic in SaaS is the use of alternative sales channels. About half of all SaaS companies are working on some type of channel partnership, and of those firms with a channel program, about one quarter of all sales are being assisted by a channel partner in some way. For a deeper look into channels, you might consider reading Should Your SaaS Company Have a Channel Sales Strategy?
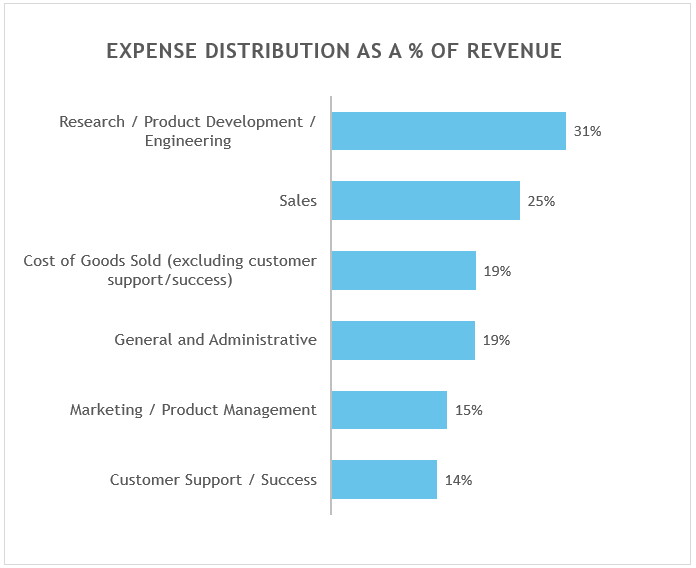
Spending
Knowing how to allocate scarce resources in a SaaS company is critical to its success, and knowing how others are spending their money could help with your allocation decisions. Later this year we will publish a deeper dive into these results based on horizontal vs. vertical, VC funding or bootstrapped, and company size.
The above charts are from the complete 2018 SaaS Survey Results which you can download below. The survey also benchmarks pricing and payment metrics as well as LTV and CAC benchmarks. Downloading will also allow you to participate in next year’s survey and receive the results as soon as they are published.
Our Approach
Who Is SaaS Capital?
SaaS Capital® is the leading provider of long-term Credit Facilities to SaaS companies.
Read MoreSubscribe