What is the Average Deal Size for Private SaaS Companies?
July 10, 2025
While there’s no shortage of data on public SaaS companies thanks to their reporting requirements, those benchmarks often don’t reflect the reality of smaller, private businesses. Public company metrics tend to skew higher due to scale, funding, and market position. To provide more relevant benchmarks, SaaS Capital conducts an annual survey focused solely on private, B2B SaaS companies. Our 14th annual report includes data from over 1,000 respondents and highlights key trends in Annual Contract Value (ACV) across company sizes, retention levels, and funding types.
What is the average ACV for Private SaaS Companies?
Across all companies in the 2025 survey, the median ACV is $26,265, up from $22,357 the previous year. But like prior years, it’s more useful to look at deal size by company size and how it’s changed over time. The graph below shows the most recent ACV by Annual Recurring Revenue (ARR) band, with 2023 data included for comparison.
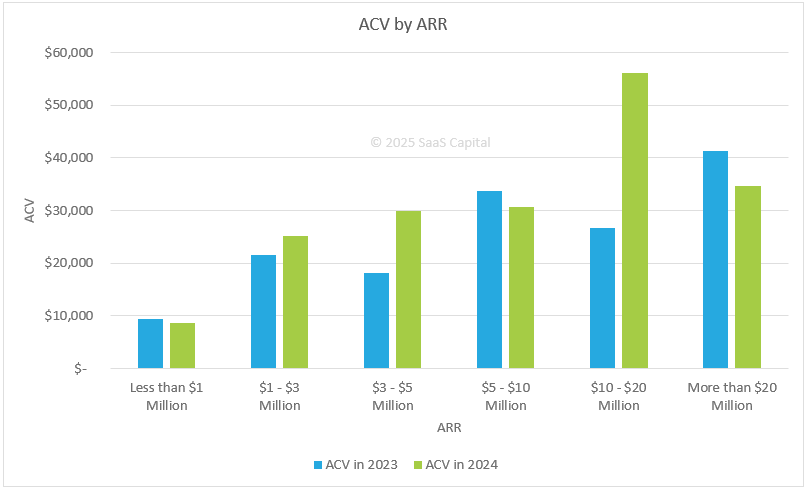
There are two main takeaways from this chart.
First, deal size generally increases with company size, which aligns with what we’ve seen in past surveys. For example:
- Companies with $3–5 million in ARR saw ACV rise from $18,075 in 2023 to $29,947 in 2024.
- Companies with $10–20 million in ARR more than doubled, from $26,738 to $56,101.
This pattern reflects how larger companies tend to offer more robust platforms, sell into more complex accounts, and feel more confident charging higher prices as they gain traction.
Second, not every group followed a straight line. The $5–10 million ARR segment saw a decrease in ACV, from $33,704 in 2023 to $30,592 in 2024. While that drop may not be dramatic, it runs counter to the broader trend and raises questions. It’s possible this segment was more aggressive on pricing to drive volume, or there may be reporting variability. Either way, it’s a data point worth watching next year.
Also, changes in ACV are worth noting as research by Randall Lucas in Changing ACVs: The Hidden Control Lever of SaaS Company Value showed that companies with higher ACV growth tend to grow faster, and those with flat to shrinking ACVs grow the least.
Average Deal Size by Retention Rates
Previous research on retention showed that higher Net Revenue Retention (NRR) typically accompanies higher ACVs. That relationship continues to hold in the 2024 results, although the jump is not always linear.
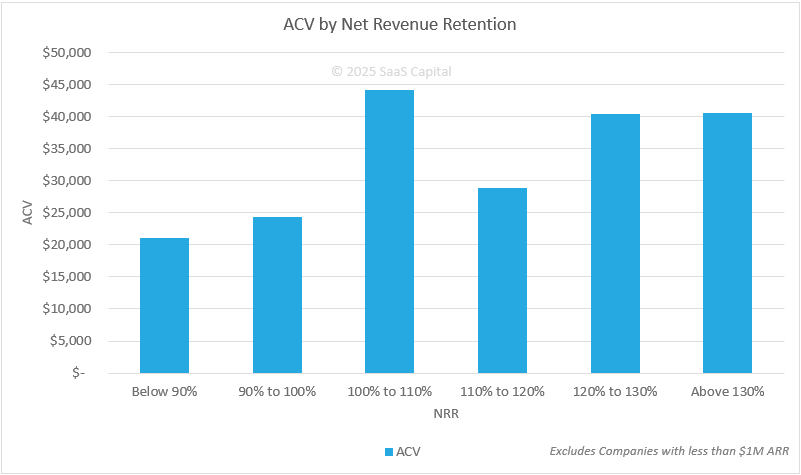
Companies with NRR below 90% report a median ACV of $21,017. From there, ACV rises steadily:
- $24,299 for companies with 90–100% NRR.
- $44,073 for those with 100–110% NRR.
The pattern is briefly disrupted between 110–120%, where ACV drops to $28,853, before rising above $40,000 for companies with over 120% retention.
Despite that mid-range dip, the overall takeaway is clear. Companies with high retention tend to command higher deal sizes, and in many cases, that’s because they start with a broader platform or more flexible pricing strategy. Strong NRR usually reflects a product that customers can grow into.
Average Deal Size by Funding
Bootstrapped and equity-backed companies often optimize toward different goals, and the data shows that this has a measurable impact on both deal size and company size. The table below shows the median ACV and ARR by funding type for private SaaS companies with more than $1 million in ARR.
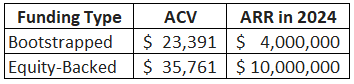
In 2024:
- Bootstrapped companies reported a median ACV of $23,391 and a median ARR of $4 million
- Equity-backed companies reported a median ACV of $35,761 and a median ARR of $10 million
This lines up with what we’d expect given previous research, which shows that bootstrapped companies spend less, optimizing for profitability, while equity-backed companies spend more to optimize for growth. Funded companies tend to scale faster and expand their product offerings sooner, which allows them to target larger customers and increase deal size. Bootstrapped companies are more focused on efficient growth, and while that can lead to strong margins, it usually limits the pace of ACV expansion.
Final Thoughts on ACVs
There’s no universal benchmark for deal size that applies to every SaaS company but the updated data from our 2024 survey provides a solid reference point for founders and operators who want to compare their ACVs against peers and think strategically about pricing and packaging in 2025.
If you’re focused on growth, expanding deal size might be one of the most effective levers you have. Whether that’s through deeper functionality, better segmentation, or upsell opportunities, increasing ACV can improve both topline growth and long-term valuation.
Our Approach
Who Is SaaS Capital?
SaaS Capital® is the leading provider of long-term Credit Facilities to SaaS companies.
Read MoreSubscribe