Discussion and Empirical Data on the SaaS Rule of 40
May 5, 2017
The Rule of 40, which postulates that the growth-rate-plus-profitability-margin of a healthy growth stage (>=$50M ARR) SaaS company should be at least 40%, is a compelling and fascinating ‘rule.’
It is compelling because we humans love really powerful, but simple things. Here is one number that can tell you whether your company is succeeding or not. More precisely, it captures both valuation drivers of a SaaS business: growth and profit, and trades them off dollar for dollar. It is a clear numerical manifestation of the undeniably true statement: “You either need to be growing or making money.”
It’s a fascinating ‘rule,’ because it was basically proposed by a faceless growth stage investor, without much context, data, or rationale, so the door is wide open for discussion. Therefore, the “40,” it must be pointed out, is completely arbitrary. Higher is better of course, but there are some great SaaS businesses that are operating below this metric, and still creating value for their owners. Pushing to reach this metric might not even be that productive if the market opportunity is not there. It is an aspirational number, and makes good sense as a target for an investor looking for above-average performers, but it is by no means the cut-off line between healthy and unhealthy as originally positioned. Our data, and that from a separate survey from Pacific Crest, both show that the empirical median growth-plus-profitability (GP) ratio for over 1,000 SaaS companies is in the 20-35% range.
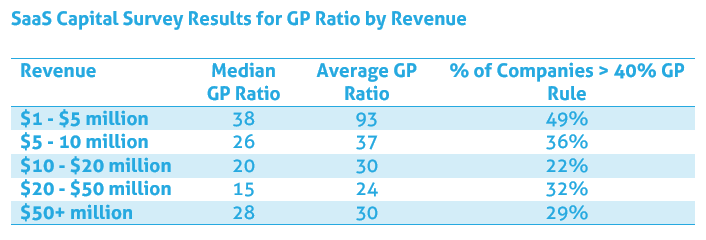
While it is the smallest companies that score closest to the 40% GP ratio benchmark, we know that the metric is least useful here since the companies vary so dramatically, and growth rates tend to be higher for smaller companies because the denominator is smaller. As we would expect due to the daunting math of growth, growth rates tend to decline as companies grow. Surprisingly, however, the GP ratio pops back up again significantly for very large companies. It’s not quite to 40%, but to 30%, and anecdotally scanning the raw data we see that this is more often than not driven by profitability, rather than due to growth rate making up for burn.
To further compare notes with Pacific Crest, below is a bubble chart of the GP ratios for our survey respondents. Note that this view is cropped; there are outliers in all directions of the chart.
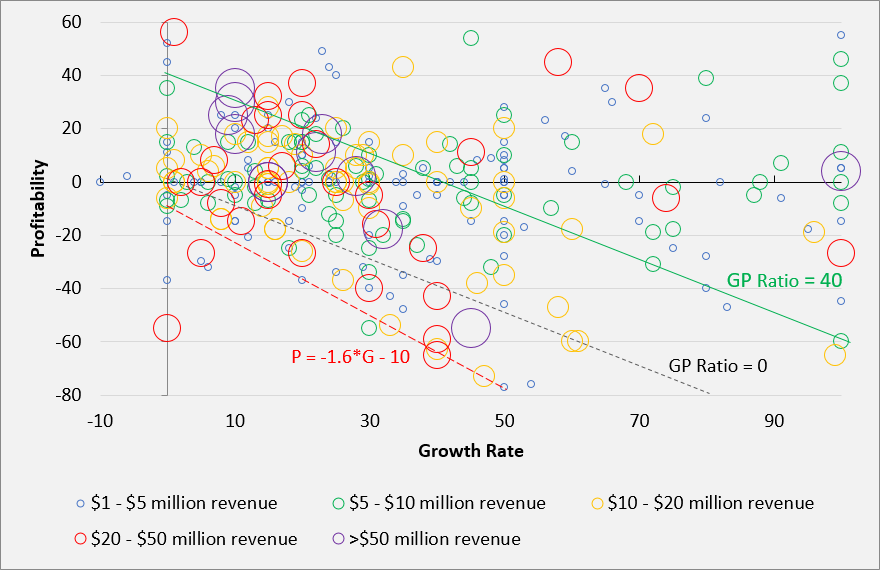
Some notes:
- Variance is very high for all but the largest companies. Interestingly, even fairly established companies ($20-50 million in revenue) appear all across the spectrum of growth-vs-profitability, in both ‘good’ and ‘bad’ quadrants.
- But as companies reach and surpass $50 million, they appear to shift toward profitability. There is a particularly dense cluster at 10% growth and 20-30% profitability. The two obvious outliers are at 100% growth and 0% profitability and 45% growth and -50% profitability. The former appears to have captured lightning in a bottle, and the latter, at a point below the GP Ratio of 0 line, is clearly in a much less happy place. It could be that the company is struggling, but it also could be that they are investing heavily ahead of future growth. Again, a higher GP ratio is generally better, but more context is always needed.
- As noted, the ‘rule’ is a best of breed-seeking threshold for an investor, and the data suggests that most companies run a GP ratio of 0 to 35. But in the chart above we actually see a fair number of companies below the GP = 0 line. Presumably these companies are venture-backed and building towards future value creation. But interestingly, at least according to our data, there’s a point at which the ratio becomes untenable. From our data, there are very few companies whose burn rate is 60% higher than their growth rate (plus 10%).
Our Approach
Who Is SaaS Capital?
SaaS Capital® is the leading provider of long-term Credit Facilities to SaaS companies.
Read MoreSubscribe