Private SaaS Company Valuations: Q3 2020 Update
October 2, 2020
With the third quarter of 2020 now closed, below are our observations of the SaaS industry and an update to the SaaS Capital Index, which tracks public company valuation multiples. Our Q3 SaaS sector observations include:
- Financing, M&A, and strategic activities unfroze compared to Q2. Portfolio companies and prospects focused internally in the second quarter, attending to cost cutting, customer outreach, retention, re-forecasting, and planning for the impact of the pandemic. The Paycheck Protection Program and Economic Injury Disaster Loans (PPP and EIDL) appear to have been successful in getting cash into companies’ hands – nearly every company we’ve spoken to received some amount of funds – and helped companies keep staff employed. All of these factors meant that capital markets and M&A activity dropped significantly in May and June. Anecdotally from our own experience, the third quarter saw a return to nearly pre-pandemic levels of corporate external activity.
- The public markets have been volatile over the last 6 weeks with uncertainty around COVID-19, the US election, unemployment, and potential government stimulus – all the while public SaaS companies generally continued to post strong financial performance. The SaaS Capital Index snapped to an all-time high of 14.7x at the end of August. Stock prices immediately cratered the first week of September, but have rebounded somewhat. Despite the broader market ending September lower than the month prior, the SCI on September 30 actually ended slightly higher than the end of August at 15.0x. This is due to two nuances with our creation of the index.
- The first is simply data availability and timing of updates. Companies report at completely different times throughout the quarters and months. We update each company’s revenue when they post their quarterly reports, so updates can alter the index. Since most SaaS companies are growing, new revenue data, all else equal, tends to adjust to the upside.
- The second item, and the bigger of the two, which offsets the early September stock price pull-back, is the addition of several new companies to the SCI due to their IPOs in Q3. Over the last 12 months, we have added a net of 10 companies to the index, which is nearly 10%. I say net because a few companies were acquired over the past year and dropped out of the index. Many of the new companies, like Ncino, Big Commerce, and Duck Creek Technologies, are trading at multiples above the index median, pulling it up higher, while the overall markets were down from the end of August high point.
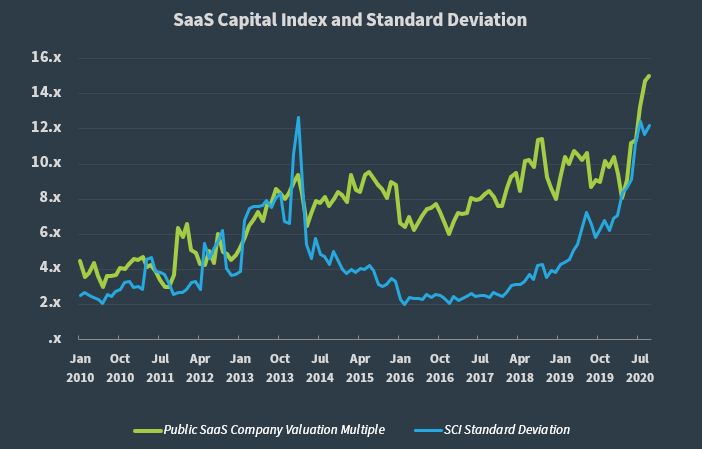
- When markets rise quickly, the increases are typically not felt equally across the board. Higher growth companies will see prices rise faster (but also pull back harder on down days) than slower growth, more stable companies. Remember, one of the components of the valuation framework is the predictability of revenue; a slower growth company actually has more predictable revenue than a high growth one, therefore its valuation will swing less. Compounding the discrepancy between the haves and have-nots in the current market is the impact of COVID-19-related market dynamics on individual companies. Some companies, like Zoom Video Communications, are beneficiaries of the move to work from home, while SaaS companies that sell to commercial real estate managers, for example, are likely struggling. This is all to say that while the SCI multiple is hitting all-time-highs, the variance among the representative companies has also risen substantially. Below is the chart of the SCI valuation multiple and its standard deviation. The SCI is the median of all companies, so the valuation multiples of more than half of the companies are rising quickly, but many valuation multiples are holding steady. Like the public-to-private discount, it will be interesting to watch how those relationships behave over the coming months.
- Lastly, our portfolio capital markets and M&A activity over the years has resulted in a historical public-to-private market discount of 28%. The SCI is now significantly elevated above its long-term range and we are curious to see if this discount remains intact (i.e. will private valuations rise with public prices?) or will it widen if private valuations remain about where they are. Or, will the public markets return to their historic range? The only certain thing is that the private data is much less frequent and has much longer lag times, so it will be a while before we know the answer. For this quarterly update, we have added a line for the estimated private company valuation multiple through time.
SaaS Company Valuation Multiples
Background: Public SaaS company data is the best starting point when valuing a private SaaS business, so we created the SaaS Capital Index (SCI) to be an up-to-date valuation tool for pure-play, B2B, SaaS businesses. The SCI excludes companies with very low annual contract values (ACV) as these companies have characteristics more similar to B2C companies than B2B. The index is based on annualized current run-rate revenue (ARR), not trailing or projected revenue like other indices use. For background on the SCI, please see our Q1 update and our valuation framework for private SaaS companies.
As of September 30, the median SaaS valuation multiple for public companies stands at 15.0x ARR. Applying the historical private company discount of 28%, the estimated valuation multiple for private SaaS companies is currently 10.8x ARR. The chart below shows the long-term trend.
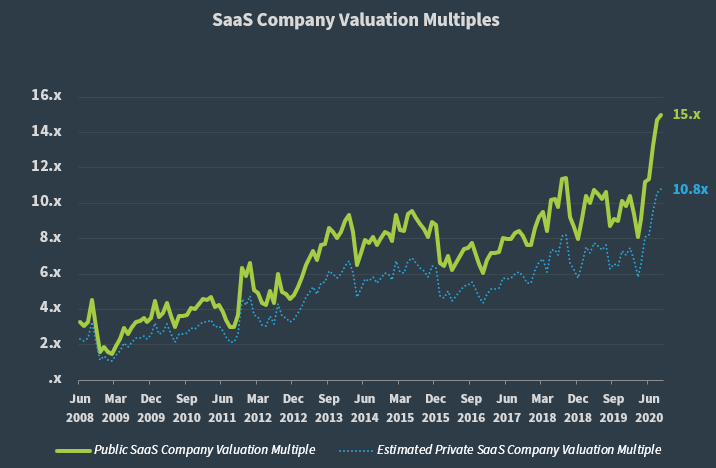
In our Q2 2020 update, we saw that the public market valuations were sitting near all-time highs. The SCI has now surged into uncharted territory as it jumped 32% from where it sat at the end of the second quarter.
Year-to-Date SaaS Capital Index Performance vs. the Broad Market
After a drop in March, the SCI rebounded to show a strong gain by the end of June. Now, despite a volatile September, the 9/30 closing prices have the SCI still sitting 10 percentage points higher than where it stood at the end of the second quarter, and showing a 47% year-to-date gain.
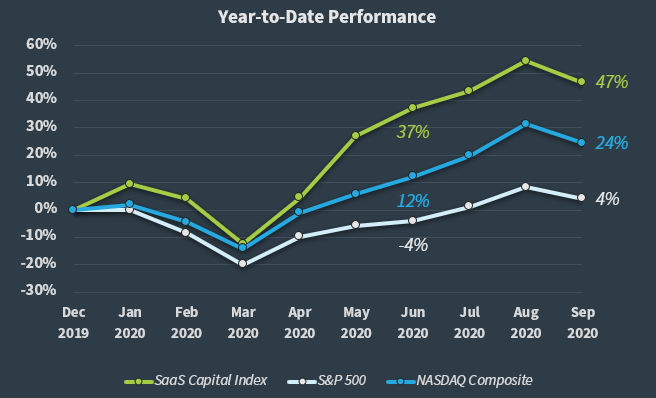
Of the stocks in the SCI that have been trading since 12/31/19, 83% are now positive on the year, with 34% of the stocks showing a gain of more than 50%. The average year-to-date gain is 55%, and the median gain is 26%.
SaaS Capital Index Companies with the Highest Multiples
As shown in the first chart in this post, the median SaaS valuation multiple for public companies in the SCI stands at 15.0x ARR. The table below lists the companies from the SCI with the 10 highest ARR multiples.
| Company | Current Multiple | YTD Multiple Change | YTD Stock Price Change | YTD Revenue Change | YoY Revenue Change |
| DataDog | 55.3x | 99% | 170% | 46% | 68% |
| Zoom Video Communications, Inc. | 50.4x | 82% | 591% | 298% | 355% |
| Bigcommerce Holdings, Inc. (BIGC) | 38.4x | #N/A | #N/A | #N/A | #N/A |
| Crowdstrike Holdings Inc | 37.9x | 88% | 175% | 59% | 84% |
| Coupa Software Incorporated | 37.5x | 59% | 88% | 24% | 32% |
| nCino | 37.2x | #N/A | #N/A | #N/A | #N/A |
| Okta, Inc. | 34.2x | 44% | 85% | 31% | 43% |
| Fastly, Inc. | 33.1x | 246% | 368% | 50% | 62% |
| Duck Creek Technologies Inc. (DCT) | 30.4x | #N/A | #N/A | #N/A | #N/A |
| Veeva Systems Inc. | 30.x | 61% | 100% | 26% | 33% |
Earlier this year, we saw that Zoom Video Communications (ZM) and DataDog (DDOG) led the pack for priciest companies, and that remains the case. DataDog is now taking the top slot with a price at just over 55 times ARR. Recent IPOs and additions to the SCI, Bigcommerce Holdings, nCino, and Duck Creek Technologies Inc. (DCT) also make the top ten.
SaaS Capital Index Companies with the Lowest Multiples
The table below shows the companies from the SCI with the lowest ARR multiples.
| Company | Current Multiple | YTD Multiple Change | YTD Stock Price Change | YTD Revenue Change | YoY Revenue Change |
| FireEye Inc | 3.x | -24% | -25% | 2% | 9% |
| Upland Software Inc | 3.9x | -7% | 6% | 30% | 35% |
| Cornerstone OnDemand, Inc. | 3.9x | -36% | -38% | 4% | 6% |
| Cloudera Inc | 3.9x | -8% | -6% | 8% | 9% |
| Zuora | 4.1x | -27% | -28% | 4% | 8% |
| Talend SA ADR | 4.5x | -10% | 0% | 8% | 12% |
| RealPage, Inc. | 5.1x | 4% | 7% | 12% | 17% |
| Yext, Inc. | 5.2x | -6% | 5% | 15% | 22% |
| New Relic, Inc. | 5.2x | -22% | -14% | 12% | 15% |
| Domo, Inc. | 5.5x | 53% | 76% | 14% | 23% |
While most of the stocks in the SCI have rallied this year, a few have struggled. All of the companies featured in our Q2 update for the lowest ARR multiples remain on the list here. Cornerstone OnDemand retains the distinction of showing both the largest stock drop and the largest multiple decline for the year.
You can download the full data set, including company descriptions, on the SaaS Capital Index page, and you can sign up for future updates here – Join the SaaS Capital Network.
Our Approach
Who Is SaaS Capital?
SaaS Capital® is the leading provider of long-term Credit Facilities to SaaS companies.
Read MoreSubscribe