2021 Private SaaS Company Valuations
January 20, 2021
Note: In Q2 2022, SaaS Capital released a substantial update on how to value private SaaS companies. Please see that link for the details on this data-driven methodology based upon a statistical analysis of over ten years of data.
In this post, we share our SaaS industry observations at the start of Q1 2021, and update the SaaS Capital Index, which tracks public company valuation multiples. As we have noted in the past, public SaaS company data is the best starting point when valuing a private SaaS business, so we created the SaaS Capital Index (SCI) to be an up-to-date valuation tool for private, pure-play, B2B, SaaS companies to use to help determine their own value. The SCI excludes companies with very low annual contract values (ACV) as these companies have characteristics more similar to B2C companies than B2B. The index is based on annualized current run-rate revenue (ARR), not trailing or projected revenue like other indices use. For more background on the SCI, please see our Q1 update and our valuation framework for private SaaS companies.
SaaS Company Valuation Multiples
In our Q3 2020 update, we saw that public market valuations for SaaS companies had surged into uncharted territory, and the momentum continued into Q4. We begin 2021 with multiples 69% higher than where they stood at the beginning of 2020.
The median SaaS valuation multiple for public B2B SaaS companies stood at 16.6x ARR on December 31, 2020.
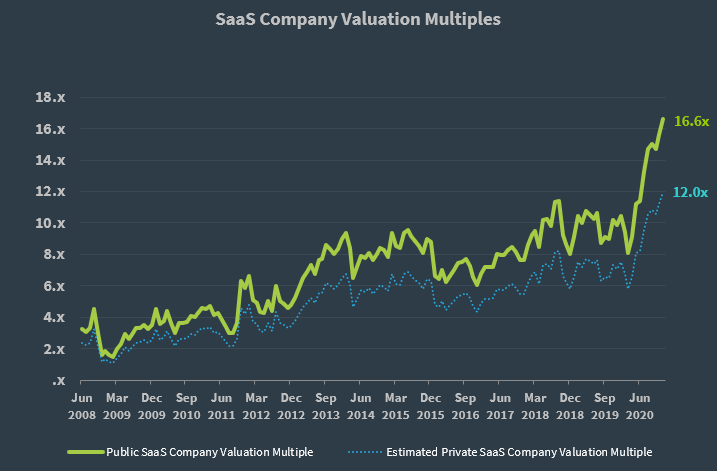
In previous research, we compared valuation multiples at financings and M&A events in our own portfolio of private, B2B SaaS companies with that of the public market at the time and determined that private valuations were typically 28% less than public valuations at the time. Applying the historical private company discount of 28% to the current market, the estimated valuation multiple for private SaaS companies is currently 12.0x ARR. The chart above shows the long-term trend for public valuations and our estimation of private valuations. Note that the private company valuation trend line in the chart above is a simple ratio to the public index, and as of January 2021, we have not seen a run up in private valuations as the dotted line estimation in the chart above would imply. All private valuation multiples we have seen in the second half of 2020 remained in the historic range of 3x to 10x, depending on company metrics. We are tracking private multiples closely and plan to document changes, if any, to our assumptive public-private discount later this year.
Public SaaS Company Valuation Multiple Standard Deviation
The story of stock price inequality – some companies are valued very highly, while others not — continues, but with some important caveats. In the chart below, you can see inequality manifest in the blue line, which is the standard deviation of the 61 public companies currently in the index. It dropped a little last month, but at 17.6x, it remains at the highest point ever.
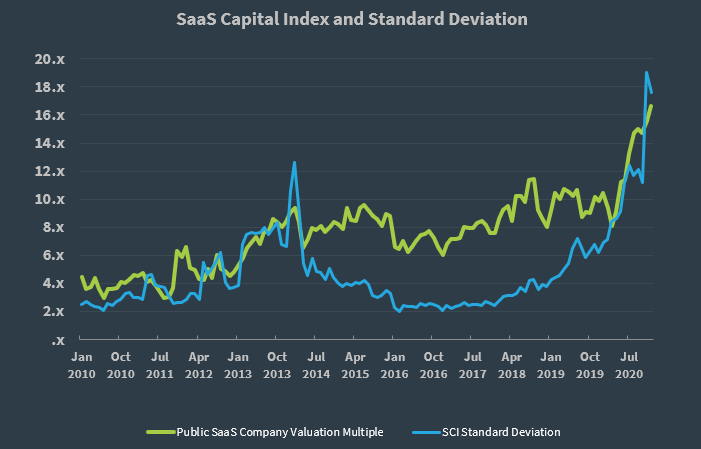
The large standard deviation is driven more by really high valuations on the high end than very low ones on the low end. True, not all companies are benefitting from the run-up in valuations, but the lowest valuation multiple out of all public SaaS companies is 3.4x run rate ARR. Ten years ago, that was the median valuation multiple! So, even the “losers” in this market are doing fine; they are lagging their peers, but it just shows that SaaS is a very bright spot in the broader economy (see the indices comparison chart below).
The high variance is driven in a significant way by just one company, Snowflake. Its valuation multiple is 123x ARR. The next highest multiple in the index is Unity Software at 52.5x ARR, and there are numerous companies in the high 30s and 40s. Removing Snowflake from the index lowers the standard deviation to 11.5, about where it had risen to over the last year before Snowflake went public and joined the SCI.
2020 SaaS Capital Index Performance vs. the Broad Market
The SCI quickly dropped to a 12.5% loss on the year by March. The rebound was swift and dramatic, with the SCI showing a 37.2% gain by the end of the second quarter. A mild rally in Q3 was followed by a surge in the fourth quarter, leaving the SCI up 78.2%, compared to the end of 2019. Overall, the SCI followed the same general trends as the broad market indices but outperformed at each stage.
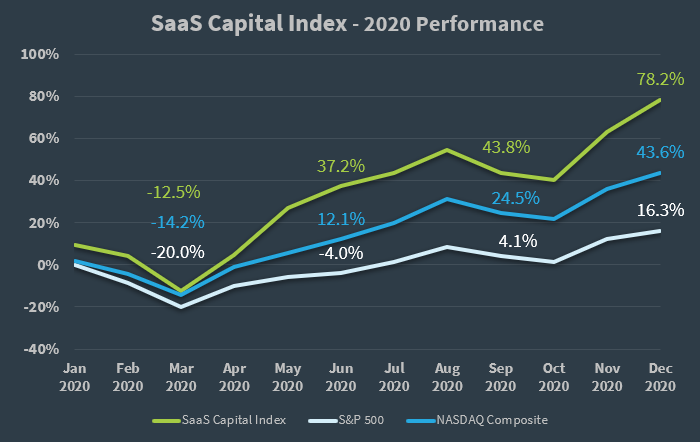
Of the stocks in SCI with a full year of trading data, only 4 didn’t show a gain on the year, and only 1 (Cornerstone OnDemand, down 25%) showed a decline of more than 3%. The median year-over-year return was 61%.
SaaS Capital Index Companies with the Highest Multiples
The table below lists the companies from the SCI with the 10 highest ARR multiples.
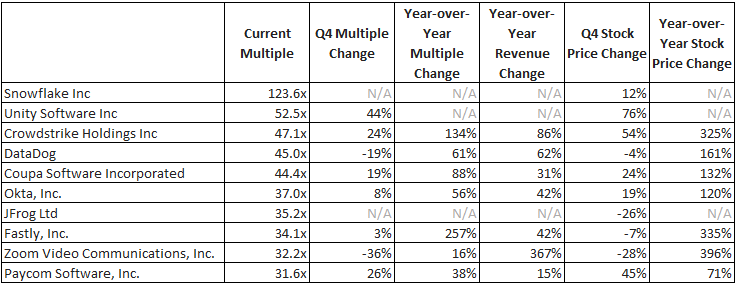
Continuing a trend we noted at the end of Q3, stocks that have recently gone public are showing extremely high multiples. Snowflake, which debuted in September, boasts the highest multiple in the SCI and marks the only stock to sport a triple-digit multiple. Second on the list is Unity Software, which also began trading in September. Zoom Video, with the 9th highest multiple in the SCI, holds the largest year-over-year stock gain – despite dropping 28% in Q4.
SaaS Capital Index Companies with the Lowest Multiples
The table below lists the companies from the SCI with the 10 lowest ARR multiples.
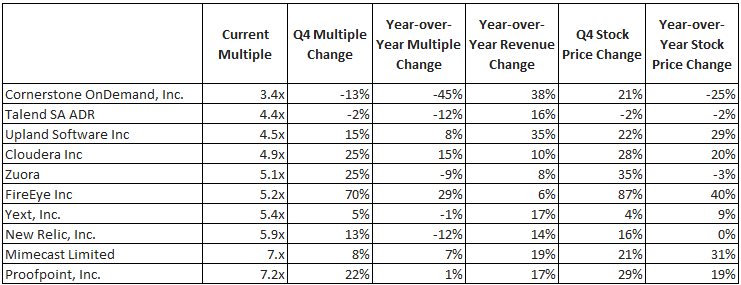
Cornerstone OnDemand ended 2020 with the lowest multiple in the SCI. For the 3rd consecutive quarter, Cornerstone OnDemand retains the distinction of the largest multiple decline and largest stock drop, leaving it the weakest stock in the SCI. The stock’s 21% gain in Q4, matches the overall median gain for all the stocks in the SCI.
FireEye remains among the stocks with the lowest multiples in the SCI, despite a rally in Q4 amid the SolarWinds hack. FireEye posted both the largest Q4 stock gain and largest Q4 multiple change.
Q4 2020 Observations and 2021 Predictions
- After a dead quiet Q2 and average Q3, the fourth quarter of 2020 absolutely exploded with financing and merger and acquisition activity. Five SaaS Capital portfolio companies sold or raised financing in the quarter, most of those happening in December.
- Public valuations continue to climb, but we haven’t yet seen private valuations pulled up to the same degree. The range of valuation multiples for our portfolio company events was 4x to 9x ARR – in line with pre-Q3 2020 private SaaS valuations. We have heard whispers of intense deal competition and higher VC and M&A valuations but have yet to see any data to this effect.
- The new US administration is discussing more, bigger, and longer-lasting stimulus to people and companies, with $1.2 trillion being the most recent high water mark. Stimulus this big will directly support the economy and indirectly support the equity markets.
- Almost all experts agree that there is more than enough slack in the economy to absorb the stimulus without raising inflation concerns.
- The Fed seems to concur and has not hinted at raising interest rates for the foreseeable future.
- More optimistically, many economists and investors are predicting a second iteration of the “Roaring 20’s” as the global economy comes out of the pandemic and pent up demand explodes (savings rates have skyrocketed over the last year).
- The software industry performed very well through the pandemic. With the rapid digital transformation of education, government, and industry, it is poised for a continued run for many years – there is no sign of the industry slowing.
- On the finance front, there are more and larger equity funds than ever before, so SaaS companies should continue to have plenty of access to capital, and as discussed above, it will be interesting to see if private valuations increase with public companies’ valuation.
- The strong stock market improves exit opportunities for private companies as well. Large public acquirers have stronger balance sheets and can make more aggressive offers.
Our Approach
Who Is SaaS Capital?
SaaS Capital® is the leading provider of long-term Credit Facilities to SaaS companies.
Read MoreSubscribe