Public-Private Valuation Gap Widens for SaaS Company Multiples
September 30, 2021
Note: In Q2 2022, SaaS Capital released a substantial update on how to value private SaaS companies. Please see that link for the details on this data-driven methodology based upon a statistical analysis of over ten years of data.
The SaaS community has been using our SaaS Capital Index (SCI) successfully to guide their thinking about valuations for over five years. Below are some important updates to the public SaaS market, private SaaS market, and our own data and analysis around the SCI.
Background
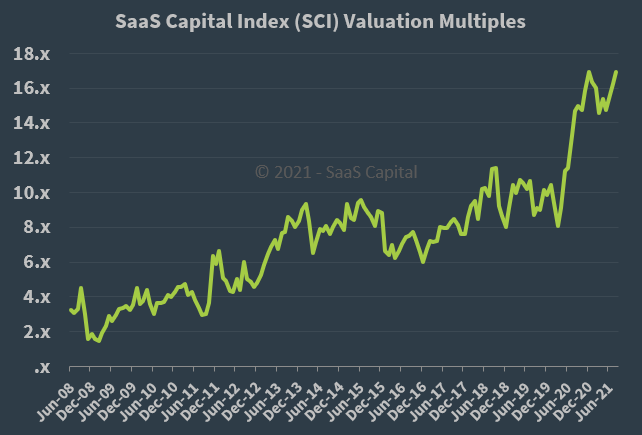
The SCI uses publicly-traded company data to track how the market values SaaS companies as a multiple of Annualized Recurring Revenue (ARR). Public companies are valued more highly (with a higher multiple) than private companies, all else equal. In 2016, we had estimated a 28% public-private “gap” in ARR multiples, which was a useful and data-driven starting place. However, given the dramatic changes in the public market over the last 18 to 24 months, we wanted to revisit that figure and see if it has changed.
SaaS Valuation Changes Pre-2020
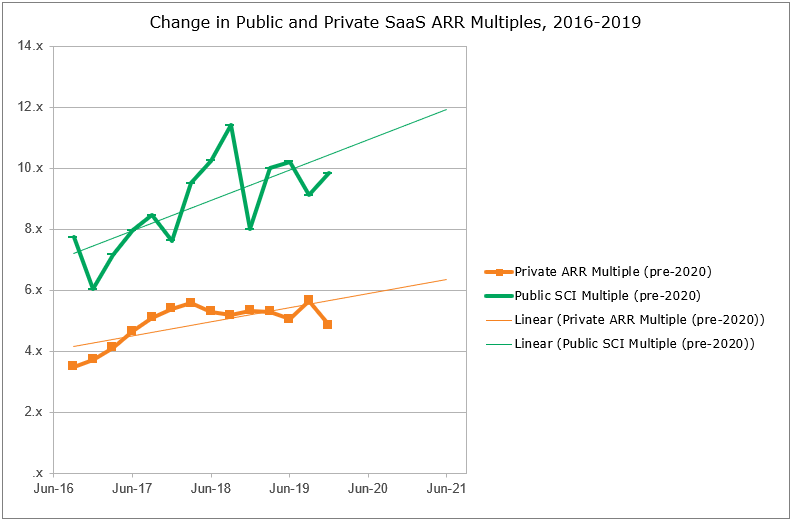
Public SaaS valuations increased faster than the broad stock market prior to 2020. The market views SaaS as an inherently attractive business model. We continue to observe SaaS companies delivering superior customer value, and capturing that value in pricing — which in turn reinforces investors’ expectations of superior returns.
Private SaaS valuations increased, but more slowly compared to public companies pre-2020. We believe this is explained partly by an illiquidity discount for being private, but also because successful SaaS models often have significant network effects or other increasing returns to scale. Since public SaaS companies skew larger, they are more likely to be enjoying tailwinds from scale.
Therefore, because of the faster increase in public valuations than in private ones, the public-private gap widened significantly, if slowly, pre-2020.
Valuation Multiple Developments Since 2020
In Q1 2020, the broader stock market took a downturn, just before setting off on a remarkable upward run. Whatever the cause, the market’s rise was not merely reflecting higher revenues (indeed, the economy suffered a true recession and revenues broadly declined). The S&P marked a sharp rise in the P/S valuation multiple (Price/Sales ratio) from a relatively stable 2x to over 3x in late 2021.
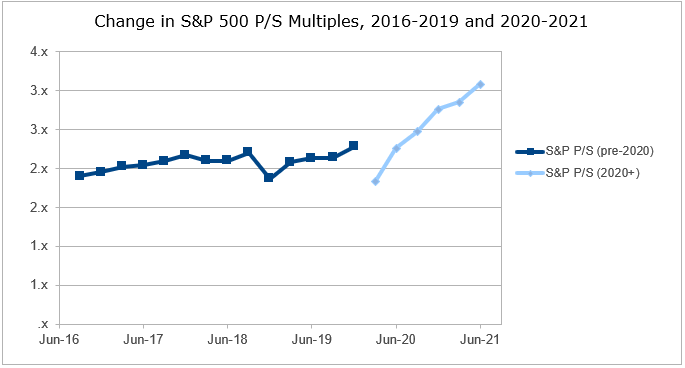
SaaS valuations are typically expressed as a multiple of Annualized Recurring Revenue or ARR, which is closely related with, but not identical to, P/S ratio. Broadly speaking though, if P/S goes up by 50%, expect ARR multiples to go up by 50% as well. Indeed, this is what happened, and the broad stock market valuation increase mostly explains the Public SaaS multiple increase.
Public SaaS company valuations ran up alongside the broader market. Public SaaS multiples, which had been previously bounded in the range of 8x-11x ARR, shot upwards in late 2020, leading the SaaS Capital Index to all-time highs between 15x and 17x ARR.
Private SaaS company multiples have run up as well, although with a slight lag based on our observations, and median private B2B SaaS multiples stand in the 7x-8x range as of late 2021.
Minding “The Gap” — Then and Now
We previously (circa 2016) had estimated a public-to-private multiple discount of 2.0-2.5x (meaning, a public company trading at 7x might be valued if private at 5x, all else equal), which in turn led to an estimated 28% public-private discount, or “gap.” A percentage-based discount is more appropriate than a fixed number of turns of ARR because it scales better with changes in public markets. If public markets decreased to 2.5X ARR, it wouldn’t mean that private companies are worth 0.0xARR! And similarly, if the public markets ripped higher, we thought a percentage discount would scale with private valuations as well. As a reflection of fast-moving market trends, this discount was always something of a moving target, and from 2016-2020 the percentage gap itself widened steadily but significantly.
After 2020, however, almost all rules-of-thumb need to be scrutinized. We set out to review our growing database of private-company transactions against our archive of public SaaS Capital Index valuation data. (We talk here about an “observed” gap instead of an estimated gap; we plan to publish more in-depth research with a well-supported estimation methodology in Q4 of 2021.)
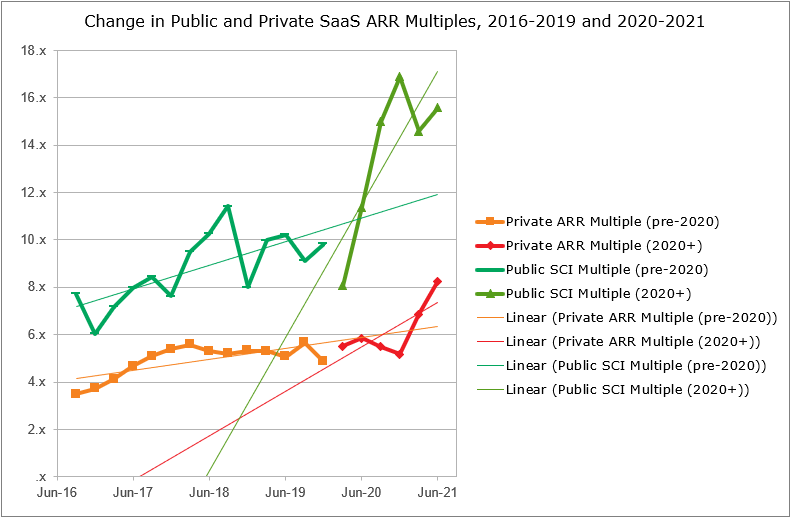
As the chart shows, our observed gap has recently averaged just over 50% (the difference between around 16x public and around 8x private). We feel comfortable stating that our observed public-to-private discount gap is, and has been about 50% for the last 12 to 18 months. We’re not sure how long this will last, but it’s a very real and data-driven observation as of 2021.
What Explains the Gap?
Is the gap the result of different growth rates between our observations and the public markets? No. While growth is “king” in SaaS stats, and should be the first place we look, this doesn’t explain the observed gap well. In fact, the median growth of public SaaS Capital Index companies has recently been in the mid-20s, while the comparable private number has been about 29% annual growth. (That said, growth of even 20% on $500M in ARR is far more impressive than growth of 29% on $5M of ARR, an effect we have previously called the “Daunting Math of Growth,” and why, in part, public companies are more valuable than private companies.)
Is the gap a public market liquidity discount? Yes, in large part. Nasdaq research into IPOs shows that tech companies tend to “pop” as high as 30%-38% on day one of trading (2021 data). This is nearly always the result of the underwriting bankers’ mistake or misalignment of incentives — every dollar in price “pop” in first-day trading is a dollar that should have gone into the company’s treasury but went to traders instead. However, the persistence of a “pop” does show that the best guess of private market makers (bankers) and the public markets (traders) is off by about that much. Therefore, we estimate that the public market liquidity discount to SaaS multiples should be about 25 percentage points of the observed gap (since a premium of 33% equates to a discount of 25%).
It’s important to note that this is probably also the most volatile component of the gap. As public markets have buoyed, the enthusiasm for public SaaS companies as shown in IPO gaps has more than doubled since 2016, when we made our initial estimate of the gap.
Is the gap a size discount? Yes, in part. After all, the public components of the SCI typically have 5x to 500x the revenue of our private company observations. It is hard to quantify exactly where the breakpoints are, but we would suggest thinking about $5 M, $10 M, and $25 M in ARR as being three major milestones. SaaS companies under $5 M rarely seem to exceed a 10x multiple. SaaS companies passing $10 M in revenue tend to have an additional “profitability option” where they have sufficient scale to be self-supporting, giving them the opportunity to wait for and build up to a more optimal exit transaction. And SaaS companies exceeding $25 M in ARR with continued growth are themselves credible IPO candidates for the coming years, giving them even more exit options. Therefore, we attribute about another 15 percentage points of the gap to a size discount.
Is the gap due to financial characteristics? Probably somewhat. Public SaaS companies often (though not always) are expected to generate positive earnings per share, while private SaaS companies usually post losses, pulling at the constraints of their capital availability to generate growth. We consider this to account for an average of 10 percentage points of the gap.
Is the gap universal?
Are all private SaaS companies at a 50% multiple discount to the SaaS Capital Index? No; as with all statistical conclusions, these are measures of the average (or median) tendency. Our analysis above indicates why we think the discount exists and what differences, across a population, explain it.
However, for an individual SaaS company, the single most important valuation factor remains growth rate. The fact that we did not attribute the discount to growth rate only makes sense if you understand that growth is equally crucial to public and private SaaS valuations.
Later in 2021, SaaS Capital will release a more comprehensive version of these findings in an update to our “What’s Your SaaS Company Worth?” white paper. Until then, the current version can be found here and we offer it with the caveat that, while the SaaS Capital Index is far higher today, the applicable public-private discount “gap” today is substantially higher than the previous estimate of 28%, and possibly as high as 50%.
Our Approach
Who Is SaaS Capital?
SaaS Capital® is the leading provider of long-term Credit Facilities to SaaS companies.
Read MoreSubscribe