Private SaaS Company Valuations: Q1 2021 Update
April 21, 2021
Note: In Q2 2022, SaaS Capital released a substantial update on how to value private SaaS companies. Please see that link for the details on this data-driven methodology based upon a statistical analysis of over ten years of data.
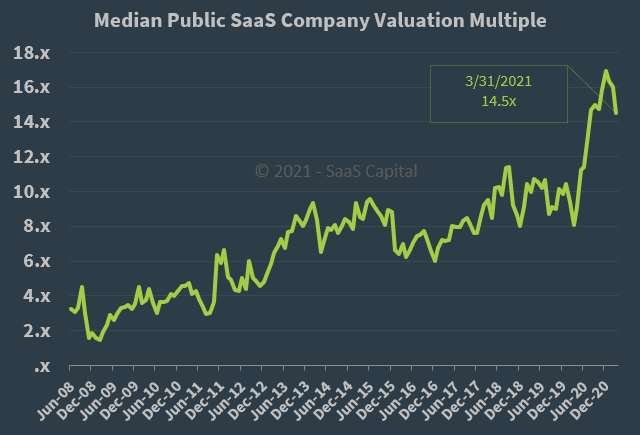
In this post, we share our SaaS industry observations on the first quarter of 2021, and update the SaaS Capital Index (SCI) through March 31st, which tracks public company valuation multiples. For more information on the SCI, please see the background section below.
SaaS Company Valuation Multiples
Private markets heated up in Q4 2020 and Q1 2021, finally catching up with the public markets that started to rip about this time last year following the initial COVID-related stock crash.
- Four of our portfolio companies raised equity funding or exited completely in Q4 2020 (we typically see 0 to 2 such events per quarter).
- From investors and management teams, we know that equity rounds available to smaller, private SaaS companies have become extremely competitive, with three of our high-growth companies (annual growth rates above 60%) signing term sheets for enterprise valuations averaging 14.3x ARR.
- *The NASDAQ Composite Index is up 7.8% year-to-date.
That said, most of the gains in the NASDAQ happened between January 1 and the middle of February. The NASDAQ is down 2.8% from its February high. The SaaS Capital Index fell from 16.0x in February to 14.5x in March. This is still well above historic norms but could signal the beginning of a correction. You can download the SCI data files here.
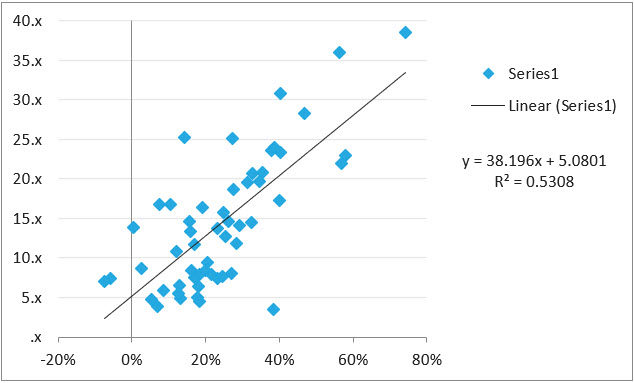
This quarter we zeroed in on growth rates and their impact on valuation. We ran a simple regression of growth rate against valuation multiple, and the resulting best-fit equation gives us these takeaways:
- The implied valuation multiple of a public SaaS company with 0% — flat — revenue growth is 5.1x ARR.
- Every 1% increase in growth rate corresponds to a 0.38 increase in valuation multiple. Nearly half a turn of ARR!
- Growth rate alone accounts for 53% of the determination of a valuation multiple.
The one caveat to this analysis is that it includes all of the companies in the SCI except for Zoom. Zoom’s current annual growth rate of 369% and its valuation multiple of 27x fall far outside the otherwise tight relationship shown in the chart below. Despite continued strong revenue growth, Zoom’s market cap peaked in October 2020 as investors assumed the pandemic-required digitization of the workplace would eventually slow, and likely pretty quickly. The valuation multiple we use for the SCI is based on current run-rate revenue, and growth rate, which is typically pretty steady. Zoom’s current market cap reflects an assumption for a lower future growth rate. Here is the chart with simple one-variable linear regression on growth rates against valuation multiples excluding Zoom.:
Lastly, we held a virtual portfolio company CEO roundtable in March. Topics of interest and discussion were: structure of quota/compensation for sales and customer success team members, experiences with international expansion, and best practices for usage-based pricing.
Background
Public SaaS company data is the best starting point when valuing a private SaaS business, so we created the SaaS Capital Index (SCI) to be an up-to-date valuation tool for private, pure-play, B2B, SaaS companies to use to help determine their own value. The SCI excludes companies with very low annual contract values (ACV) as these companies have characteristics more similar to B2C companies than B2B. The index is based on annualized current run-rate revenue (ARR), not trailing or projected revenue like other indices use. For more background on the SCI, please see this post and our valuation framework for private SaaS companies.
* Performance data as of 4/13/21 from an update sent to the SaaS Capital community. You can click here to join the community and receive actionable insights and benchmarking data for SaaS companies.
Our Approach
Who Is SaaS Capital?
SaaS Capital® is the leading provider of long-term Credit Facilities to SaaS companies.
Read MoreSubscribe