Private SaaS Company Valuations: Q2 2021 Update
July 27, 2021
Note: In Q2 2022, SaaS Capital released a substantial update on how to value private SaaS companies. Please see that link for the details on this data-driven methodology based upon a statistical analysis of over ten years of data.
In this post, we share our SaaS industry observations on the first half of 2021, and update the SaaS Capital Index (SCI) through June 30, which tracks public company valuation multiples. For more information on the SCI, please see the background section below.
Market Overview
The second quarter of 2021 was generally a continuation of the first quarter. Many sectors of the economy ran at their fastest pace in decades, with federal stimulus money and pent-up demand pushing against pandemic-disrupted supply chains. The “it” word for the quarter was “lumber”; close runner up was “inflation,” and “transitory” rounded out the podium. The S&P 500 Index was up 16% from January 1 through the end of June* (although it has dropped a little since). Software and technology were the stories in the pandemic, but durable goods and commodities are the stories coming out of it. All of the public stock market growth in 1H 2021 has been in energy, infrastructure, and financials.
Valuation Multiples for Public SaaS Companies
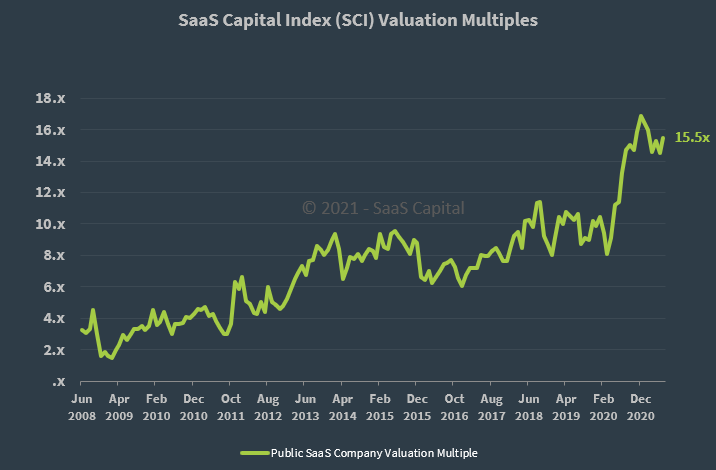
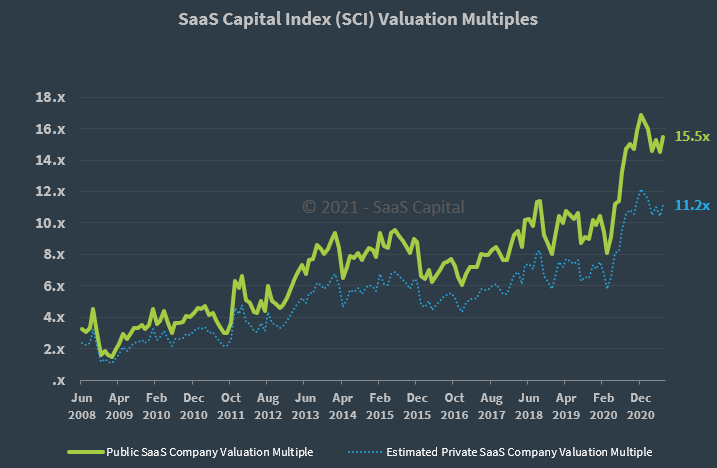
After the initial stock market pandemic-crash in March 2020, public SaaS valuations rose dramatically on the growth in remote work and rapid global digital transformation investment. As shown in the chart above, the SaaS Capital Index doubled from a low of 8.1x ARR in March 2020 to a high of 16.9x ARR by the end of the year. Since peaking at that all-time high in December, the SCI has traded in a fairly narrow range of 14.5x to 16.3x. As of June 30, the median valuation multiple for public B2B SaaS companies in the SCI remains near the middle of that range at 15.5x ARR. (You can download the raw data here.)
There is support at these valuations, but it’s clear the market thinks there’s not much room for further software multiple expansion in the current macro environment. Note that these valuations are still significantly elevated from pre-pandemic levels when 8-12x ARR was more common.
SaaS Capital Index Performance vs. the Broad Market
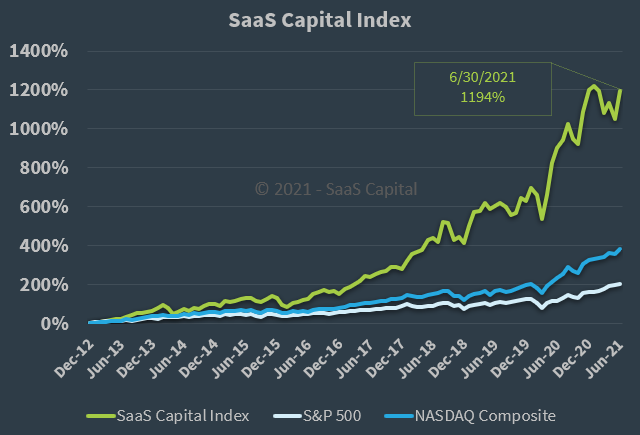
The chart above shows the long-term performance of the SCI compared to the broad market as well as the year-to-date performance. Over the past 5 years, the SCI has drastically outperformed the broad market and sits with a chip shot of its all-time high.
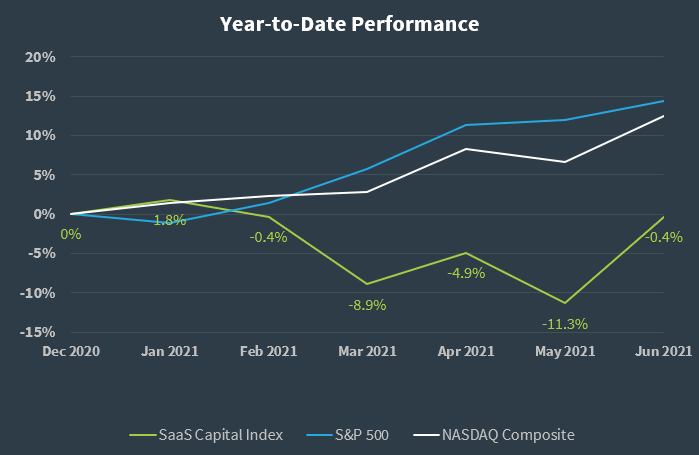
The short-term chart shows a different perspective. Year to date, the S&P 500 and NASDAQ Composite are up 14.4% and 12.5%, respectively. The SCI, however, sits at breakeven after spending much of the last months in negative territory.
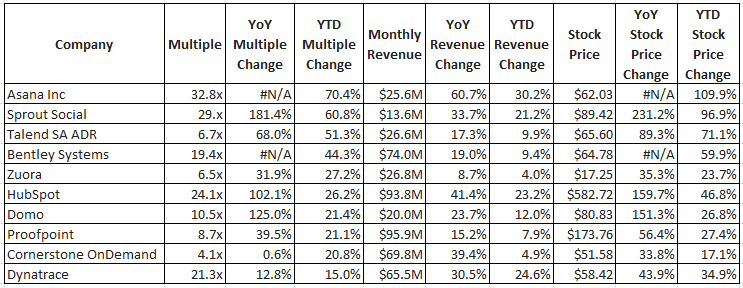
SaaS Capital Index Companies with the Highest Multiples
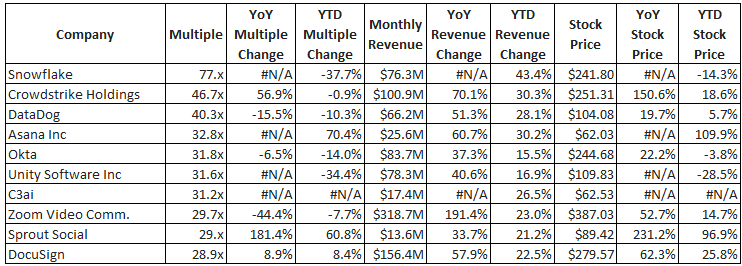
The table above lists the companies from the SCI with the 10 highest ARR multiples. Snowflake’s multiple of 77x ARR is nearly 5 times the median and 65% higher than the next highest company on the list. What’s even more astonishing is that Snowflake also takes the number two spot on the table below for the companies showing the largest multiple declines so far this year. A pattern we have discussed in the past is that the list of the SaaS companies with the highest multiples is dominated by relatively new additions. Many of the companies on this list only began trading less than a year ago.
SaaS Capital Index Companies with the Lowest Multiples
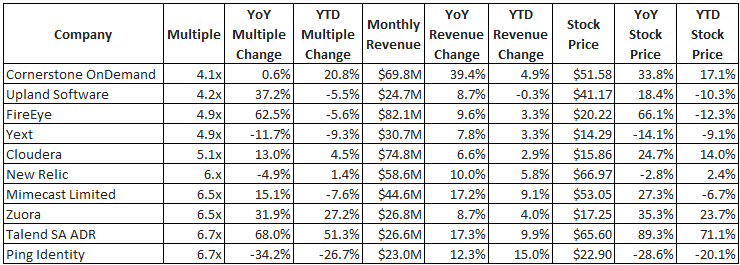
The table above shows the SaaS companies with the lowest multiples. While the order has changed slightly, the names on this list are virtually unchanged from what we saw six months ago. The only change is that Ping Identity replaced Proofpoint.
SaaS Capital Index Companies with the Largest YTD Multiple Advances
The table above shows the companies posting the largest year-to-date multiple gains. Four of the companies are still sitting at single-digit multiples. However, Asana has the fourth-highest multiple of any company in the SCI as its multiple surged 70% this year.
SaaS Capital Index Companies with the Largest YTD Multiple Declines
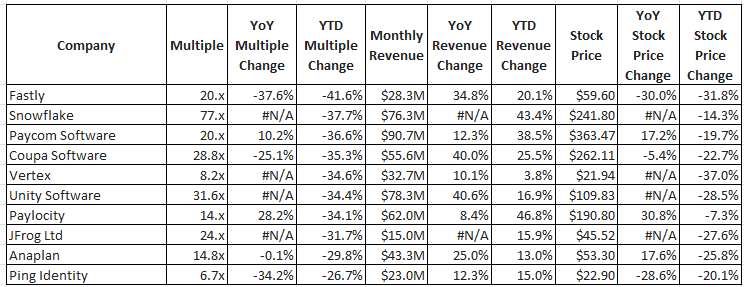
The table above shows the companies posting the largest year-to-date multiple declines. Fastly tops the list with a 37.6% decline in its multiple. The company made headlines last month after one customer changed a setting which spurred a major outage of many of the world’s top websites. While that story certainly put the company in the spotlight, it had little impact on the overall price. The company began a strong rally in May 2020 and ultimately peaked in October. The shares drifted sideways until February when a strong selloff began.
SaaS M&A Activity, Private Valuations, and Second Half Outlook
There was a rush of portfolio M&A activity at the end of 2020 on the specter of a capital gains tax regime change with the new administration, and we expected 2021 to be quieter M&A-wise, but six SaaS Capital portfolio companies have raised money or sold so far this year. But at what valuations? Anecdotally from these transactions, it looks like valuations for private, scaling-stage B2B SaaS companies are pulling up a bit, following the public markets, but to a lesser degree.
As discussed earlier this year, previous research revealed that a median private, growth-stage SaaS company valuation from about 2012 until the COVID-19 pandemic was typically 28% less than the median public SaaS company valuation at any given time.
Through 2020 we anecdotally saw this relationship diverge, but now, more than a year later with 15 transactions from our portfolio as reference points, we’re starting to get enough data to reevaluate the 28% rule of thumb. We will publish a full, specific post on just this analysis but here are the high-level takeaways:
- Double-digit ARR valuations for growth-stage companies are more common than they were pre-2020 but are still reserved for only the best performers. The division line looks to be around 50% annual growth. Data from this year’s SaaS Capital annual survey of private, B2B SaaS companies corroborates this: for companies with more than $1 million in ARR, the bottom 75% of companies are growing at less than 55% per year, while the top quartile is growing at least 55% year-over-year. The median growth rate for all companies with at least $1M in ARR is 28%.
- Median private valuations have pulled up also, albeit more modestly, from around 4x pre-2020 to around 6x ARR today. Below is a chart of the historic median public SCI, with the implied 28% private valuation discount. We have not seen the median transaction value rise to double digits as implied in the graph, suggestive of a divergence in the historical relationship.
Looking ahead, all signs point to a bullish rest of 2021. There are concerns about inflation or the Fed raising rates, but generally speaking, there is still ample demand and worker shortages in all sectors of the economy to continue solid growth through the rest of the year.
Lastly, a tweet I saw recently that resonated quite deeply was from Timo Sheridan with Avenify:
“I was born too late to explore the Earth, born too early to explore space, born just in time to build enterprise SaaS solutions for managing distributed systems at scale.”
Best of luck in the rest of 2021.
Background
Public SaaS company data is the best starting point when valuing a private SaaS business, so we created the SaaS Capital Index (SCI) to be an up-to-date valuation tool for private, pure-play, B2B, SaaS companies to use to help determine their own value. The SCI excludes companies with very low annual contract values (ACV) as these companies have characteristics more similar to B2C companies than B2B. The index is based on annualized current run-rate revenue (ARR), not trailing or projected revenue like other indices use. For more background on the SCI, please see this post and our valuation framework for private SaaS companies.
*Data as of 06/30/21 from an update sent to the SaaS Capital community. You can click here to join the community and receive actionable insights and benchmarking data for SaaS companies.
Our Approach
Who Is SaaS Capital?
SaaS Capital® is the leading provider of long-term Credit Facilities to SaaS companies.
Read MoreSubscribe